Posts

Fibonacci sequence in agile: why we use 1, 2, 3, 5, 8, 13 for story points

Planning poker cards showing Fibonacci numbers spread across a table with developer hands reaching for themPlanning poker cards showing Fibonacci numbers spread across a table with developer hands reaching for them
Matt Lewandowski

Matt Lewandowski

Last updated 16/02/20268 min read

You sit down for your first planning poker session. The team lead pulls up a backlog item and asks everyone to vote. You look at your card options: 1, 2, 3, 5, 8, 13. Where did 4 go? Why does it jump from 5 to 8? Why not just use 1 through 10? It's the question every new team member asks. And the answer reveals something fundamental about how humans estimate complex work.

What the Fibonacci sequence actually is

The Fibonacci sequence is a series of numbers where each number is the sum of the two before it: 0, 1, 1, 2, 3, 5, 8, 13, 21, 34, and so on. It was described by the Italian mathematician Leonardo of Pisa (known as Fibonacci) in 1202, though the pattern appears in nature everywhere, from the spiral of a nautilus shell to the branching of trees. Agile teams don't use the Fibonacci sequence because of any connection to nature. They use it because the gaps between numbers grow as the numbers get larger, and that mirrors how uncertainty works in software estimation.

Why linear scales fail for estimation
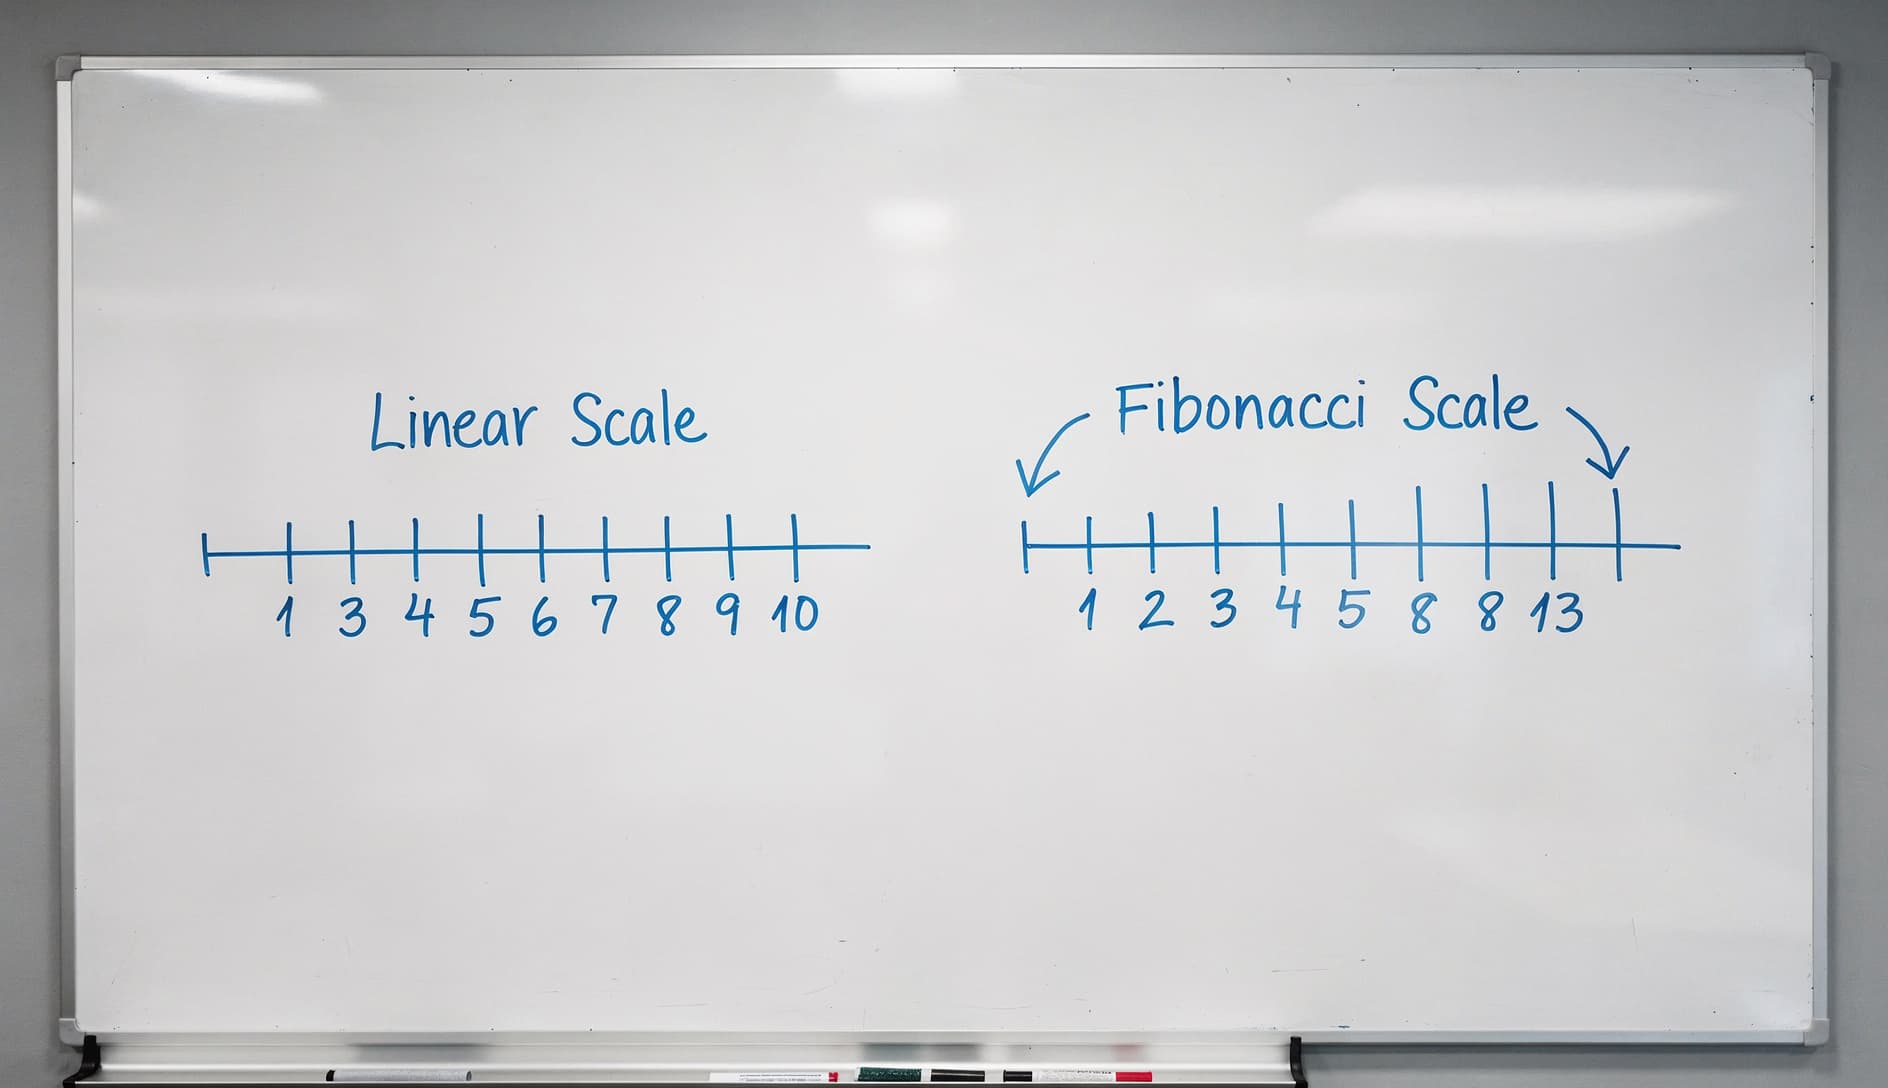
Imagine your team uses a simple 1-10 scale. Someone pulls up a story and two developers vote differently. One says 6, the other says 7. Is that disagreement meaningful? Probably not. The difference between a 6 and a 7 is so small that it's noise. But now the team spends five minutes debating whether it's really a 6 or a 7, trying to justify a distinction that doesn't exist. That's five minutes wasted on false precision. A linear scale implies that you can distinguish between levels of effort with uniform accuracy. You can't. And the bigger the item, the worse your accuracy gets. Whiteboard comparison showing a linear scale with evenly spaced numbers versus a Fibonacci scale with widening gaps between valuesWhiteboard comparison showing a linear scale with evenly spaced numbers versus a Fibonacci scale with widening gaps between values

Why the gaps matter

The Fibonacci sequence works for estimation because of three converging principles.

The cone of uncertainty

Small tasks are predictable. "Change the button color from blue to green" has minimal unknowns. You can estimate it with confidence. Large tasks carry exponentially more unknowns. "Build the payment integration" sounds like a single item, but it contains authentication, error handling, retry logic, compliance requirements, and edge cases you haven't thought of yet. The bigger the work, the wider your uncertainty, and your estimation scale should reflect that. The Fibonacci gaps widen as complexity increases, matching the reality that a 13-point story has far more uncertainty than a 3-point story. Offering a choice between 12 and 13 for something that large would be meaningless precision.

Forcing meaningful disagreement

With a Fibonacci scale, when two developers disagree, the disagreement is significant. The jump from 5 to 8 is a 60% increase. That kind of gap reflects a genuine difference in understanding: one person sees a straightforward implementation, the other sees hidden complexity. That disagreement triggers the exact conversation you want in planning poker. "Why do you think it's an 8?" "Because we'll need to handle the offline sync case." "Oh, I didn't consider that." The scale forces discussions that actually surface risks and misunderstandings. With a linear scale, a 6 vs. 7 disagreement doesn't trigger the same urgency to discuss. The gap is too small to feel important, even when the underlying assumptions are completely different.

Weber's Law

There's a principle in psychophysics called Weber's Law: humans perceive differences as proportions, not absolute values. You can easily tell the difference between 1 kilogram and 2 kilograms. But telling the difference between 50 and 51 kilograms? Much harder. The same applies to estimation. You can confidently say whether something is a 2 or a 3 (a 50% jump). You cannot confidently say whether something is a 14 or a 15 (a 7% jump). The Fibonacci sequence respects this by keeping the proportional difference between adjacent options roughly consistent, which means every choice on the scale represents a genuinely distinguishable level of effort.

The modified Fibonacci sequence

If you've used different estimation scales, you'll notice that most agile tools don't use the pure Fibonacci sequence. They use a modified version: 1, 2, 3, 5, 8, 13, 20, 40, 100 The modification kicks in after 13. Pure Fibonacci would give you 21, 34, 55, 89. Instead, teams round to cleaner numbers: 20, 40, 100. Why? Because at that scale, the precision of Fibonacci doesn't matter. Something estimated at 40 points has so much uncertainty that the difference between 34 and 40 is irrelevant. Round numbers communicate the right message: "This is very big, and we're guessing." Most teams using this scale treat anything above 13 as a signal that the item needs to be broken into smaller stories before it can be worked on.

The infinity and question mark cards

Developer holding up an infinity card and a question mark card during a planning poker sessionDeveloper holding up an infinity card and a question mark card during a planning poker session Beyond the numbers, most planning poker decks include two special cards: Infinity means "this is too big to estimate." It's the team's way of saying a story needs to be decomposed before estimation is meaningful. If someone plays infinity, the right response isn't to negotiate them down to a 40. It's to stop estimating and start splitting. Question mark means "I don't have enough information to estimate this at all." Maybe the requirements are unclear. Maybe the developer hasn't worked with this part of the codebase. Maybe the story depends on a decision that hasn't been made yet. The question mark surfaces these gaps so they can be addressed during backlog refinement before the work enters a sprint. Both cards serve the same purpose: they prevent the team from assigning a number to something that doesn't deserve one yet. A guess presented as a number gets treated as a plan. A question mark gets treated as an action item.

When Fibonacci isn't the right choice

The Fibonacci sequence is the most common estimation scale, but it's not always the best fit. T-shirt sizing (XS, S, M, L, XL) works better when you need rough, fast estimates and don't want to get into numeric debates. It's especially useful for roadmap-level planning where exact points don't matter. Read our guide on agile estimation techniques to see how T-shirt sizing and other methods compare. Power of 2 (1, 2, 4, 8, 16, 32) appeals to teams that want even more aggressive gaps between options. Every step doubles the effort, which makes disagreements even more obvious. Linear scales can work for teams doing highly predictable, uniform work where items genuinely cluster around similar sizes. But these teams usually don't need estimation at all. Counting items gives you the same forecasting accuracy. The #NoEstimates movement makes a compelling case for when to skip estimation entirely. The right scale depends on your team's context, but for most agile teams doing varied work with some uncertainty, Fibonacci remains the default for good reason.

Putting Fibonacci into practice

Understanding why Fibonacci works is useful. But the real value comes from using it in structured estimation sessions where the whole team participates. If you're running planning poker for the first time, start with the standard Fibonacci scale (1, 2, 3, 5, 8, 13). Establish a reference story early ("everyone agrees this login form change is a 3") and estimate everything else relative to that anchor. If an item generates wildly different estimates, don't average them. Discuss the disagreement. That's where the scale does its job. You can try this with your team using Kollabe's planning poker tool. Pick Fibonacci as your scale, invite your team, and start estimating. You might also want to run items through the estimation complexity analyzer before the session to identify stories that are likely to generate disagreement.

Hours measure duration, which varies by person. A senior developer might finish a task in 2 hours that takes a junior developer 8 hours. Story points measure complexity relative to other work, which the whole team can agree on regardless of who picks up the task. Points also avoid the trap of treating estimates as deadlines.

A story point represents relative effort and complexity compared to other stories your team has estimated. A 5-point story should be roughly twice as complex as a 3-point story and about half as complex as an 8-point story. The specific numbers are meaningless in isolation. They only have meaning relative to each other within your team.

Some teams include 0 in their Fibonacci scale to represent work that is trivially small, like a typo fix or a config change. It signals "this takes almost no effort but we should track it." Other teams skip 0 and use 1 as their smallest value. Either approach works, just be consistent.

If most of your estimates cluster around two values, your stories might be too similarly sized (which is actually fine for throughput forecasting) or your team might not be differentiating enough. Try recalibrating your reference stories. Make sure your "3" anchor is genuinely small and your "13" anchor is genuinely large. If everything still clusters, your stories may need to be split differently. See our guide onbreaking down epicsfor patterns.