Posts
Agile estimation techniques: beyond planning poker
Matt Lewandowski
Last updated 14/02/20268 min read
Planning poker (the baseline)
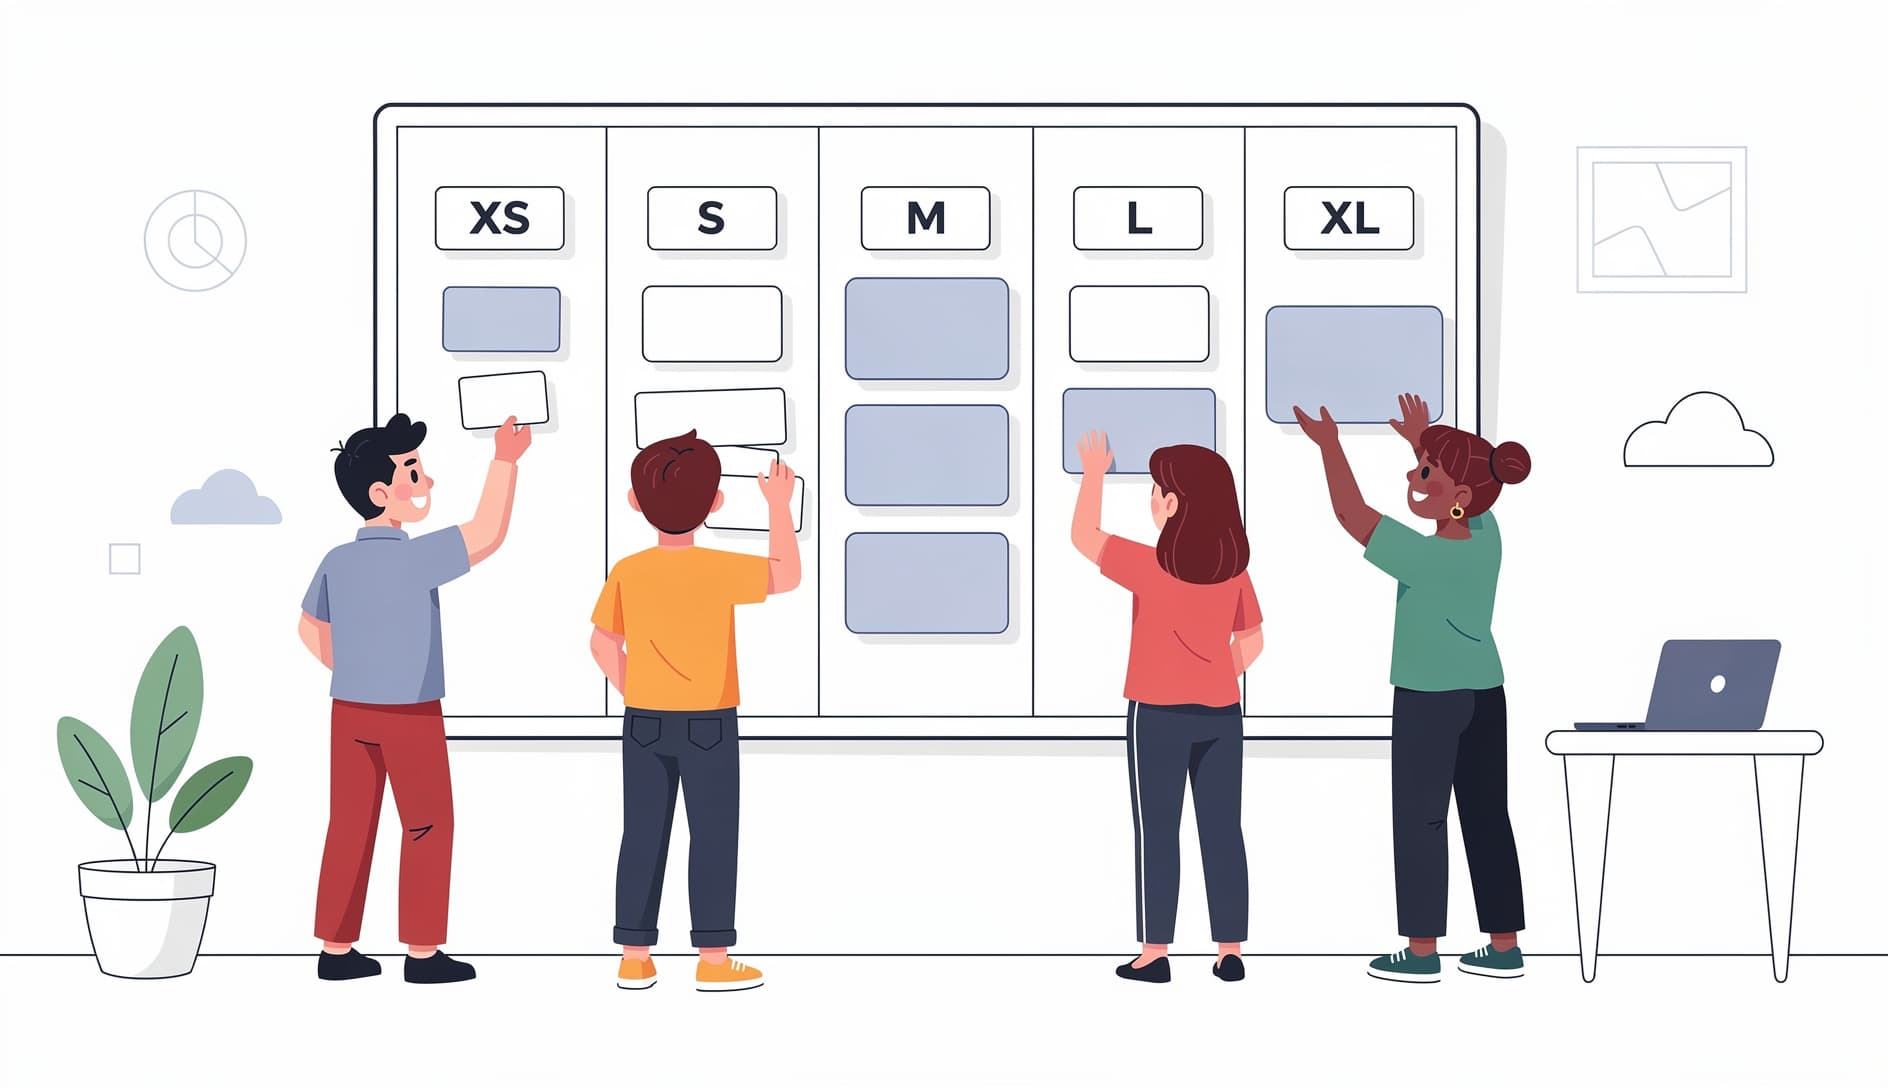
T-shirt sizing
How to run it
- Present the backlog items to the team
- Start with a reference item everyone agrees on (e.g., "This login page redesign is a Medium")
- For each remaining item, the team discusses and assigns a size relative to the reference
- If there's disagreement, have the outliers explain their reasoning and re-vote
When to use it
Affinity mapping (affinity estimation)
How to run it
- Write each backlog item on a card or sticky note
- Place the first item in the middle of a table or wall
- Pick up the next item and ask: "Is this bigger, smaller, or about the same as the first?"
- Place it left for smaller, right for larger, same column if similar
- Continue with each item. Team members can silently rearrange items they disagree with
- Once all items are placed, draw column boundaries and assign size labels to each group
When to use it
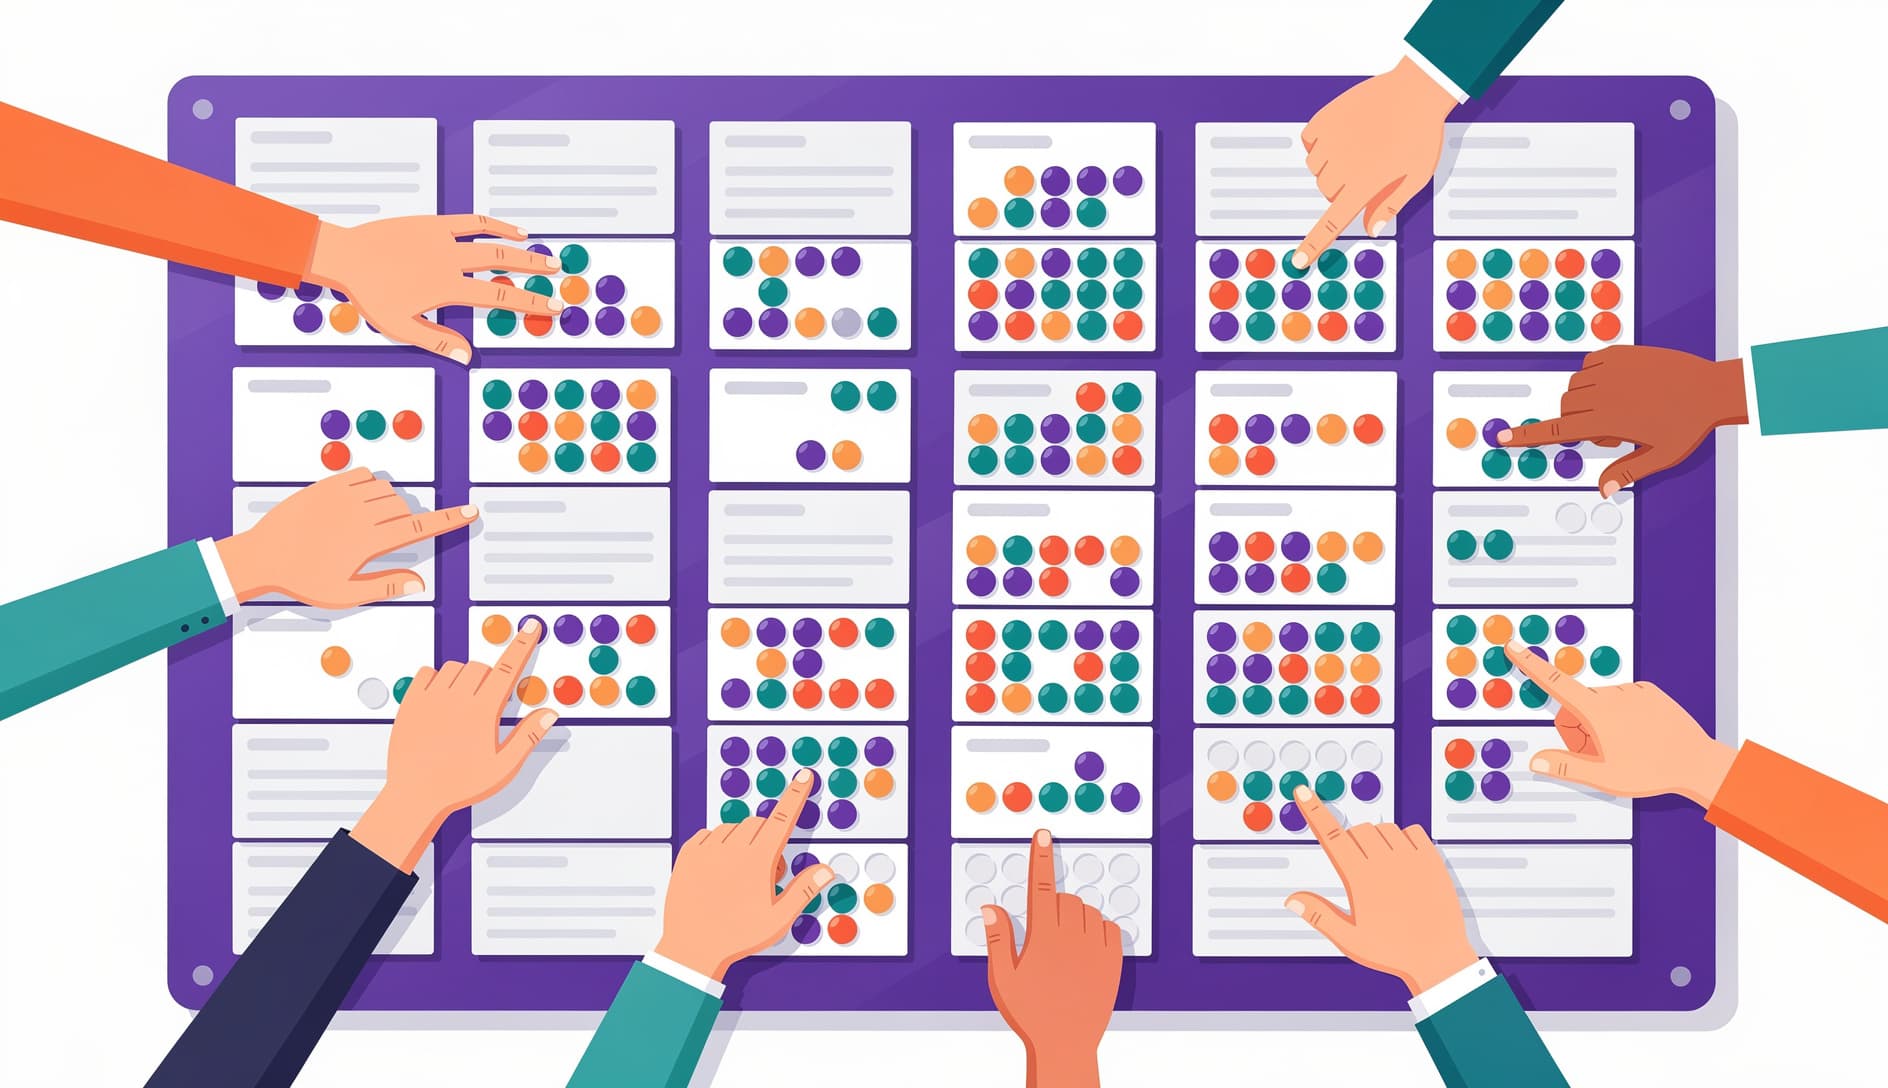
Dot voting
How to run it
- List all items on a board (physical or virtual)
- Give each team member a fixed number of dots (typically 3-5)
- Each person places their dots on the items they consider highest priority
- Items with the most dots rise to the top
When to use it
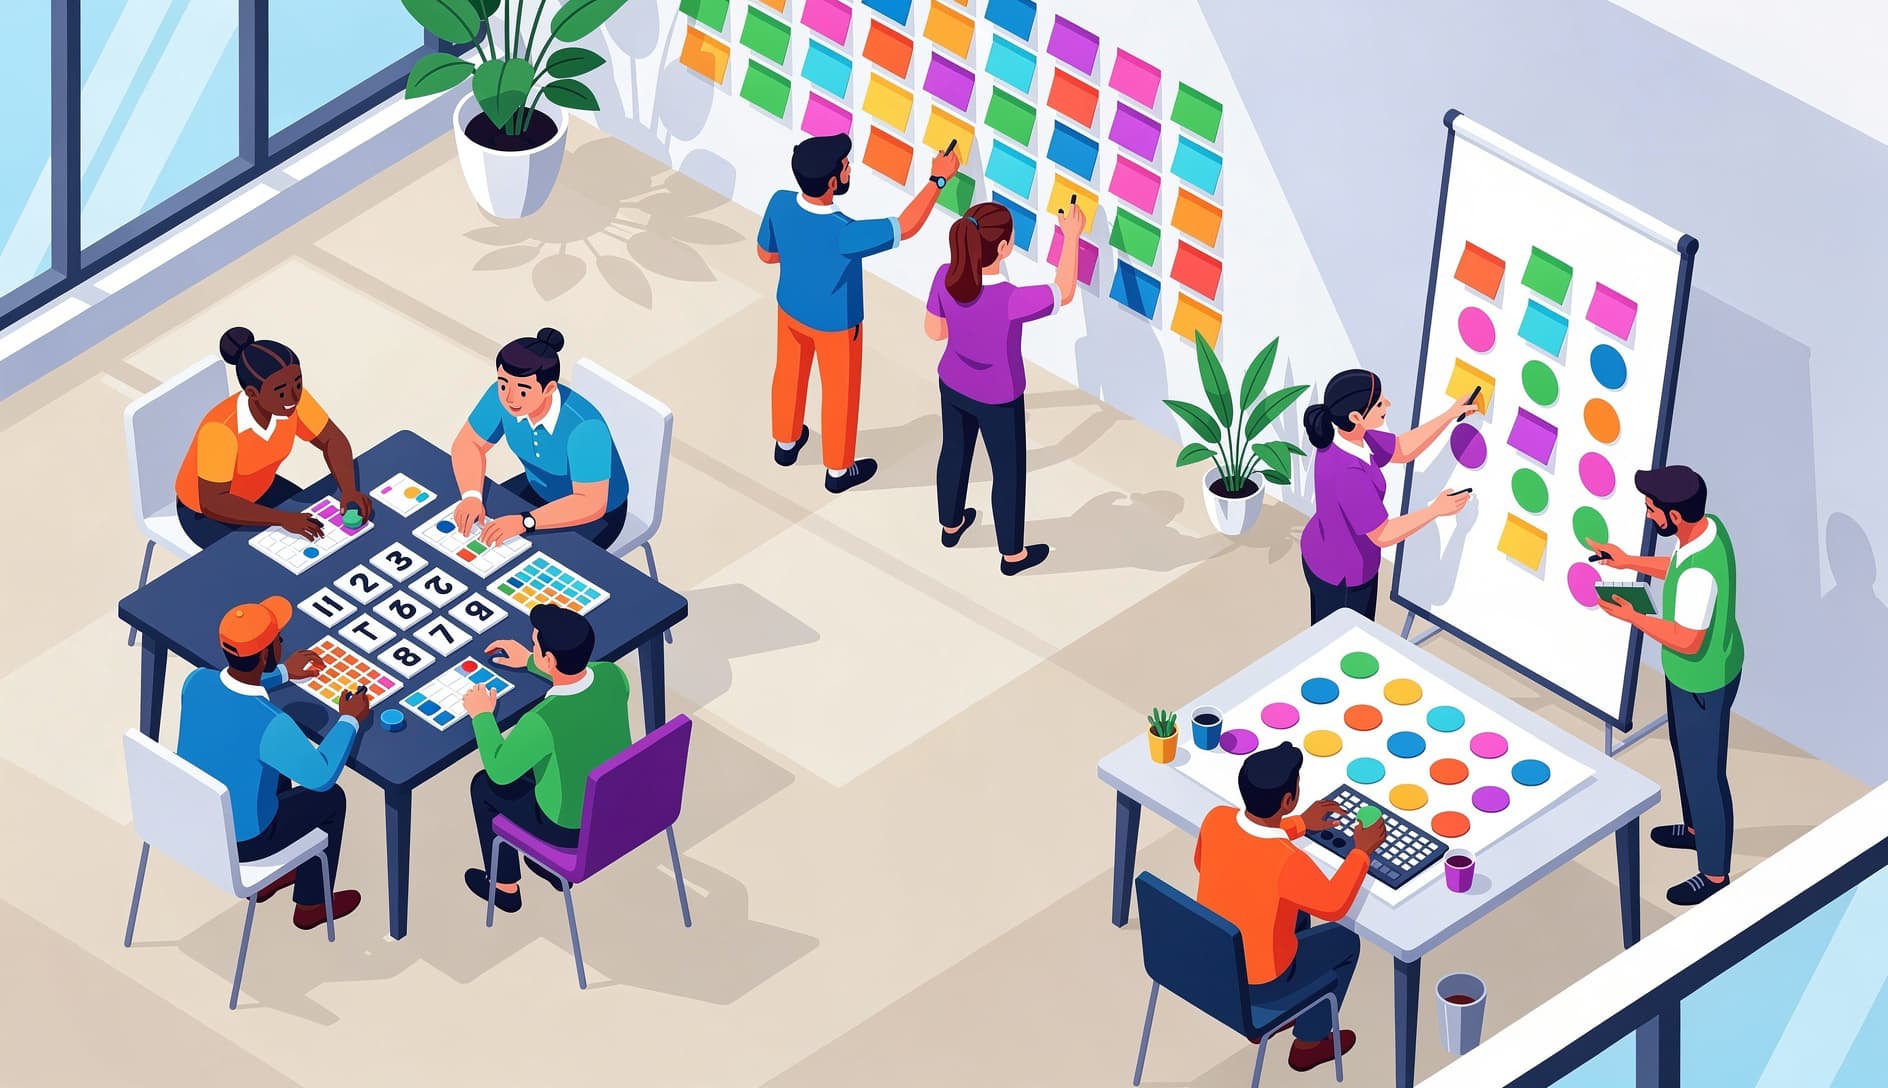
Bucket system
How to run it
- Create "buckets" representing estimate sizes (0, 1, 2, 3, 5, 8, 13, 20, 40, 100)
- Pick one item and place it in a bucket as a reference (the team must agree on this one)
- Deal the remaining items evenly among team members
- Each person silently places their items into buckets relative to the reference
- Once everything is placed, the team reviews together and discusses items that seem misplaced
- Adjust and finalize
When to use it
Three-point estimation (PERT)
How to run it
| Estimate | Meaning |
|---|---|
| Optimistic (O) | Everything goes perfectly, no surprises |
| Most Likely (M) | Realistic scenario with normal friction |
| Pessimistic (P) | Everything that can go wrong does |
When to use it
Picking the right technique
| Scenario | Best technique |
|---|---|
| Sprint planning with 10-15 items | Planning poker |
| Roadmap planning with rough sizing | T-shirt sizing |
| Large backlog (30+ items), limited time | Affinity mapping |
| Prioritizing what to estimate first | Dot voting |
| Huge backlog (50-200 items), large team | Bucket system |
| High-uncertainty work | Three-point estimation |
A few things that apply to all of them
- Estimate relative to each other, not in absolute terms. "This is twice as complex as that login page" is more useful than "this will take 3 days."
- Timebox the session. Estimation has diminishing returns. Set a timer and move on when you're close enough.
- Re-estimate when you learn something new. Estimates are snapshots, not commitments. Update them as requirements get clearer.
- Track accuracy over time. After a few sprints, compare estimates to actuals. The patterns will tell you where your team is consistently off. If your team consistently struggles with certain types of stories, an estimation complexity analyzer can help identify hidden complexity factors before you estimate.