Posts
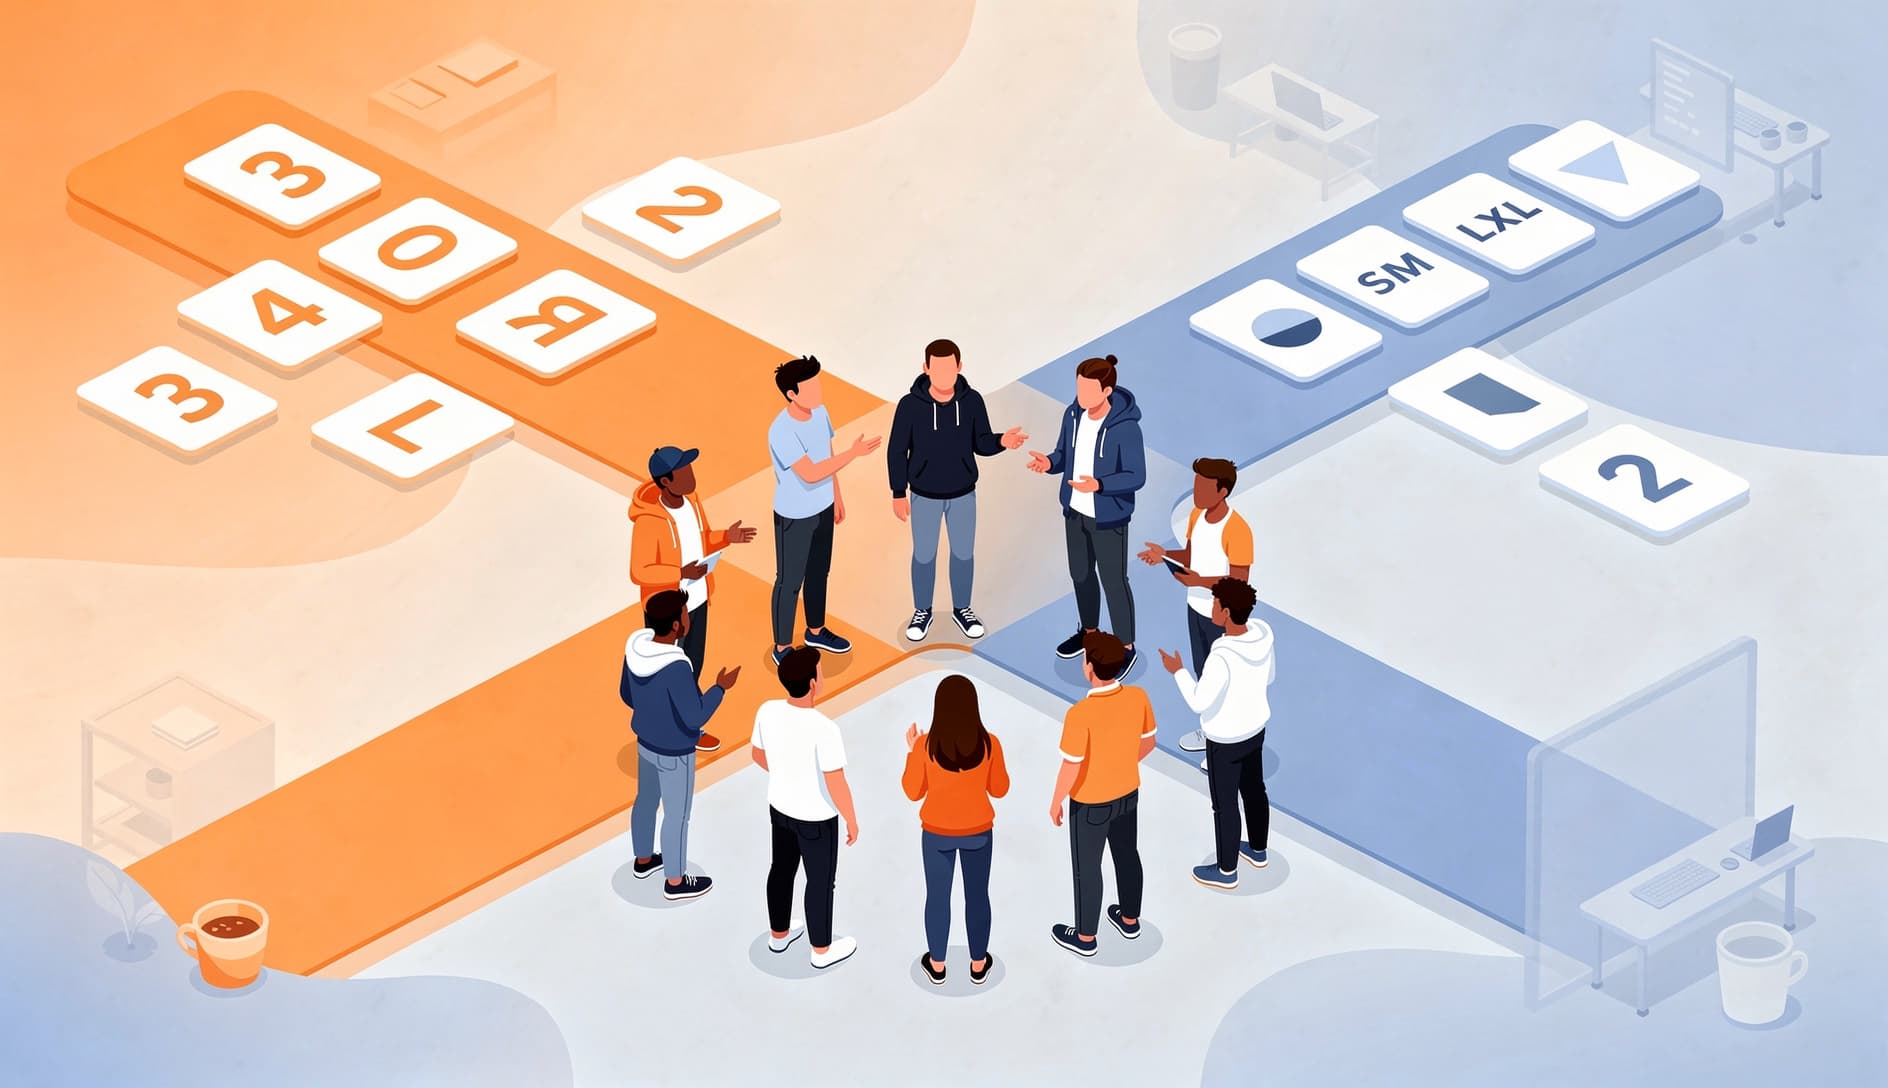
T-shirt sizing vs Fibonacci: which estimation scale should your team use?

Matt Lewandowski
Last updated 16/02/202610 min read
What each scale is
Fibonacci sequence
T-shirt sizes
How each works in a planning poker session
Fibonacci in practice
- "I said 5 because the API integration is straightforward — we've done it before."
- "I said 13 because we still need to handle the error states, and the third-party docs are terrible."
T-shirt sizing in practice
- "I think this is a Large. There's a lot of unknowns."
- "I'd call it a Medium. The unknowns are real, but the core work is something we've built before."

Side-by-side comparison
| Dimension | Fibonacci | T-shirt sizing |
|---|---|---|
| Precision | Higher. Numeric values allow for granular differentiation between items. | Lower. Fewer categories mean less precision, but also less false precision. |
| Speed | Moderate. More options can lead to longer debates (is it a 5 or an 8?). | Faster. Fewer options and no math means quicker convergence. |
| Learning curve | Steeper. New team members need to understand relative sizing with numbers. | Shallow. Everyone knows what a "Medium" means intuitively. |
| When scope is unclear | Can feel forced. Assigning a number to something you don't understand well creates false confidence. | Works well. "This feels like a Large" honestly communicates uncertainty. |
| Capacity planning | Easy. Numbers add up. 5 + 8 + 13 = 26 points in the sprint. | Harder. You need a numeric mapping or a different approach to sum capacity. |
| Stakeholder communication | Requires explanation. Non-technical stakeholders often ask "what does 13 mean?" | Intuitive. Product managers and executives understand "Large" immediately. |
| Anchoring risk | Moderate. Numbers can anchor the team to specific values from past stories. | Lower. Abstract labels are harder to anchor to. |
| Velocity tracking | Native. Story points feed directly into velocity charts and burndowns. | Requires conversion. You need to map sizes to numbers to track velocity. |
Decision framework
Use Fibonacci when...
- You need sprint-level forecasting. Fibonacci points feed directly into velocity tracking, capacity planning, and burndown charts. If your team commits to a specific amount of work each sprint, numeric points make the math straightforward.
- Your team is experienced with estimation. Teams that have been estimating for a while can leverage the granularity of Fibonacci to make meaningful distinctions between a 5 and an 8.
- You're integrating with project management tools. Jira, Azure DevOps, Linear, and most tools expect numeric values for story points. Fibonacci maps directly.
- You want to use estimation for detailed discussion. The numeric range gives teams more vocabulary for expressing differences in perceived complexity, which surfaces more specific disagreements.
Use T-shirt sizing when...
- You're doing roadmap or epic-level estimation. When planning quarters ahead, the precision of Fibonacci is wasted. T-shirt sizes give you the right level of fidelity for long-range planning.
- Your team is new to estimation. T-shirt sizing has a lower barrier to entry. New teams can start estimating productively from day one without a primer on Fibonacci sequences.
- Non-technical stakeholders are involved. Product managers, designers, and executives participate more naturally when the scale uses familiar labels.
- You want to move faster through the backlog. With fewer options to choose from, teams converge faster. T-shirt sizing sessions often run 30-50% shorter than Fibonacci sessions on the same backlog.
- You're estimating items with high uncertainty. When scope is genuinely unclear, T-shirt sizes communicate "we think this is big" without the false confidence of "we think this is exactly 13 points."
Can you combine them?
- Quarterly planning: The product owner presents upcoming epics and features. The team sizes them using T-shirt sizes. "This payment integration is an XL. This settings page redesign is a Medium." This gives product leadership enough information to sequence work and staff appropriately.
- Backlog refinement: As epics approach the sprint boundary, the team breaks them into individual stories and estimates those stories using Fibonacci during planning poker sessions.
- Sprint planning: The team pulls Fibonacci-estimated stories into the sprint based on their velocity.
Modified Fibonacci and other hybrid scales
Modified Fibonacci
T-shirt sizes with numeric mapping
Confidence-weighted estimation
Making the switch
- Run a parallel sprint. Estimate the same backlog using both scales and compare the experience. Which one generated better conversations? Which one moved faster?
- Check your pain points. If your current sessions feel slow and debates feel nitpicky, T-shirt sizing might help. If your forecasts feel imprecise and sprint commitments are unreliable, Fibonacci might give you more signal.
- Ask the team. Estimation works best when the team owns the process. If developers find the current scale frustrating, their buy-in will be low regardless of which scale is theoretically better.
- Give it time. Any new scale feels awkward for the first two or three sprints. Don't abandon it after one session.