Standup Analytics
Matt Lewandowski
January 12, 2026
Standup Analytics
See how your team is really using async standups. Track participation trends, celebrate consistent contributors, and understand which questions resonate—all from a dedicated analytics dashboard in your team space.
What's New
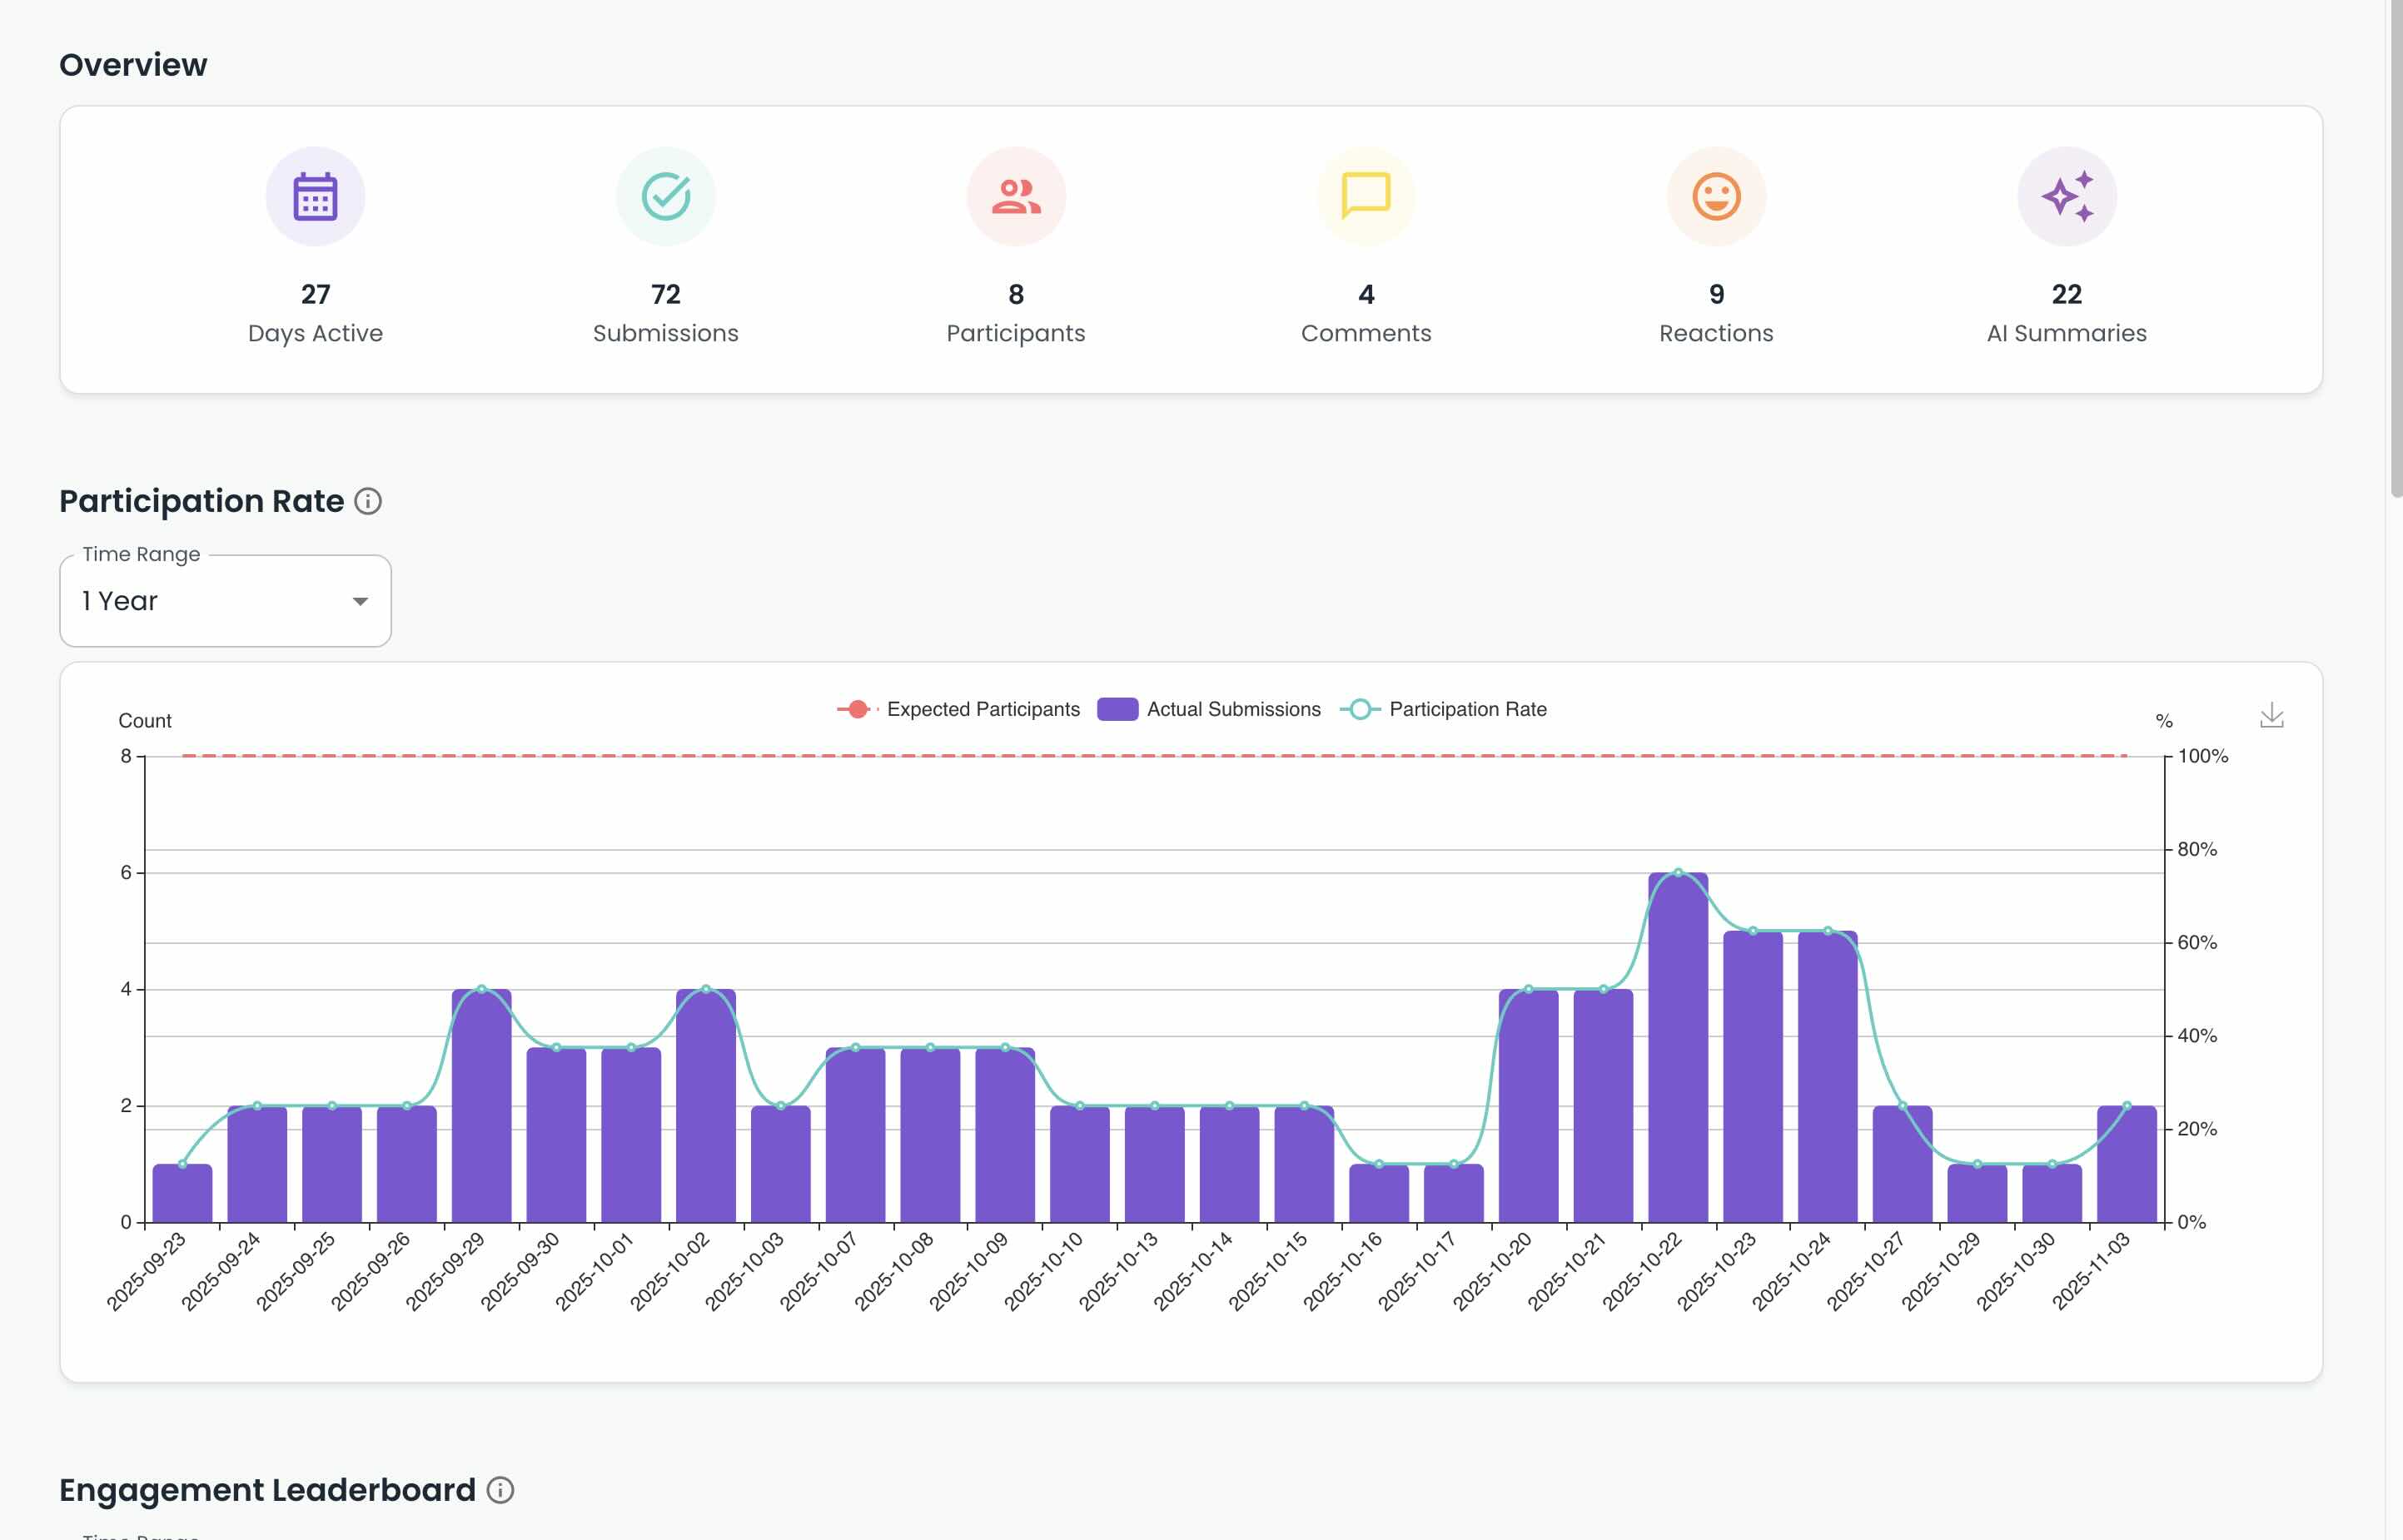
Participation Overview
Get the big picture at a glance. See total days active, submissions, participant count, comments, reactions, and AI summaries generated across your standup history.
Participation Rate Tracking
Visualize expected vs actual submissions over time with a participation trend line. Spot patterns, identify gaps, and see when engagement dips before it becomes a problem.
Expected participants: See how many team members should be submitting
Actual submissions: Track real participation day by day
Trend line: Participation rate percentage over your selected time range
Engagement Leaderboard
See who's contributing most with breakdowns by submissions, comments, and reactions. Recognize your most engaged team members and identify who might need a nudge.
Streak Leaderboard
Celebrate consistency. Track current streaks and longest streaks for each team member—perfect for friendly competition and accountability.
Question Analytics
Understand which standup questions get the most engagement. See total answers per question and average answer length to learn what prompts detailed responses vs quick updates.
Why It Matters
Running async standups is easy. Knowing whether they're actually working is harder. Without visibility into participation patterns, you're guessing at engagement until someone stops showing up entirely.
Analytics surface the signals early. You'll see participation trends before they become problems, recognize consistent contributors, and learn which questions actually get your team talking.
Available now under Analytics → Daily Standup in your team space.